Edit chart
Loading graph
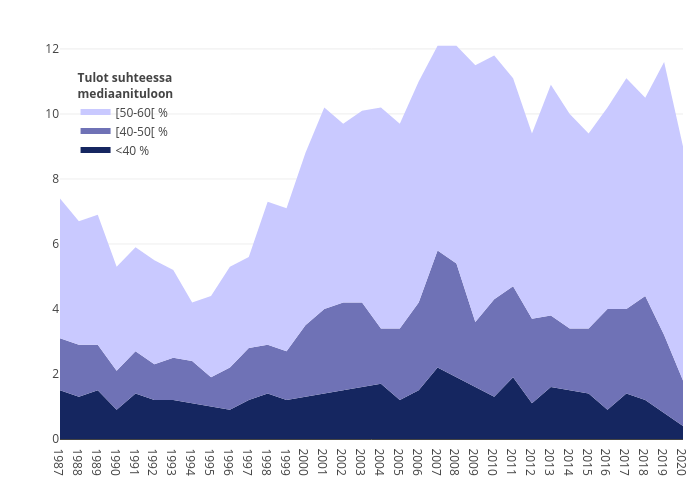
Itla's interactive graph and data of "<40 %, [40-50[ %, [50-60[ %" is a , showing <40 %, [40-50[ %, [50-60[ %. The x-axis shows values from 0 to 0. The y-axis shows values from 0 to 0.